- Dashboard
- Widgets
- AI Diary
- AI Humanizer
- AI Image
- Audio Editor
- Base64 / URL Encoder
- Calendar
- Canvas
- Collection
- Color Picker
- Container
- Countdown Timer
- Currency Converter
- Daily Quiz
- Daily Quote
- Daily Riddle
- Date & Time
- Embed
- GitHub Releases
- Google Calendar
- Habit Tracker
- Hacker News
- Image Compression
- IP Info
- JSON Formatter
- Links
- Markdown Editor
- News
- News Summary
- Notes
- Photo Frame
- Podcast
- Pomodoro Timer
- Product Hunt
- QR Code Generator
- Quick Answer
- Quick Note
- Regex Tester
- RSS Feed
- Search
- Spacer
- Stopwatch
- Story Snippet
- Stripe Sales
- Subreddit
- Substack
- t0ggles Focus
- t0ggles My Boards
- t0ggles My Tasks
- Tasks
- Text Diff
- Todo
- TradingView Advanced Chart
- TradingView Market Summary
- TradingView Mini Chart
- TradingView Symbol Overview
- TradingView Ticker Tape
- Translation
- Unit Converter
- Uptime Monitor
- Weather
- What If
- World Clock
- YouTube Channel
Uptime Monitor Widget


The Uptime Monitor widget keeps an eye on your websites and services so you always know if they're up and running. Add any URL, and the widget checks it regularly, showing you the current status, response time, and a visual history of the last 24 checks.
#How to Use
Click Add Site to get started. Enter the URL of the website you want to monitor (for example, https://example.com) and optionally give it a name. If you leave the name blank, the widget uses the hostname automatically. Click Save, and the widget starts monitoring right away.
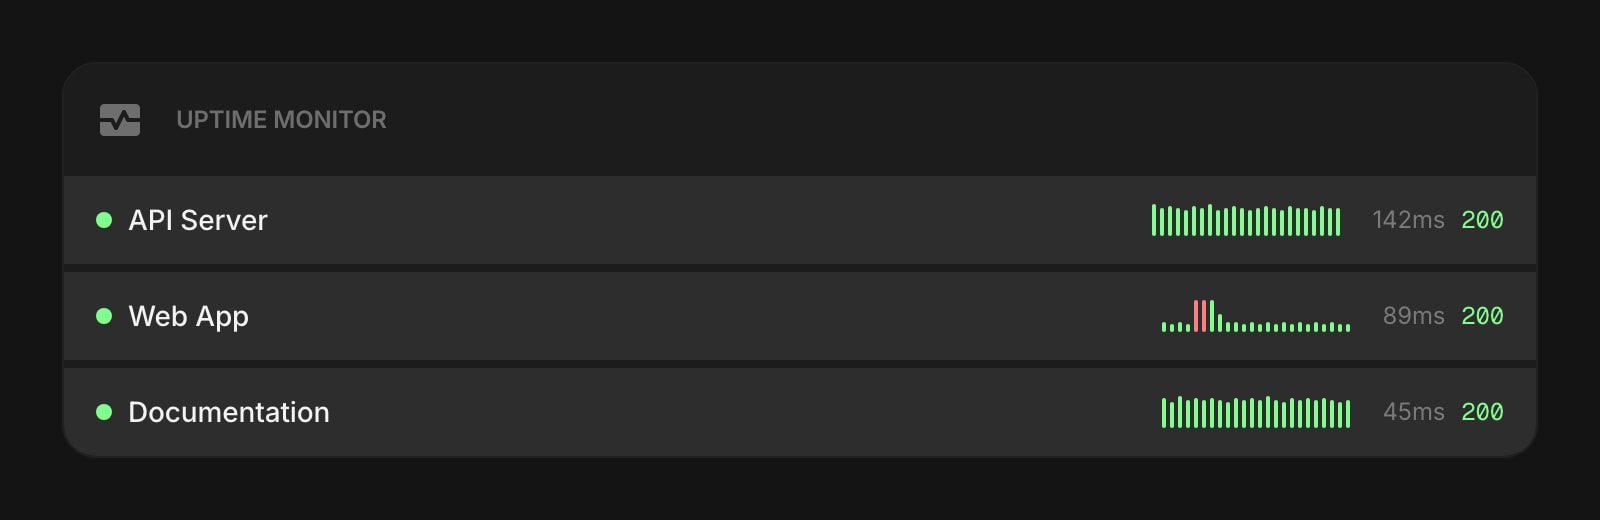
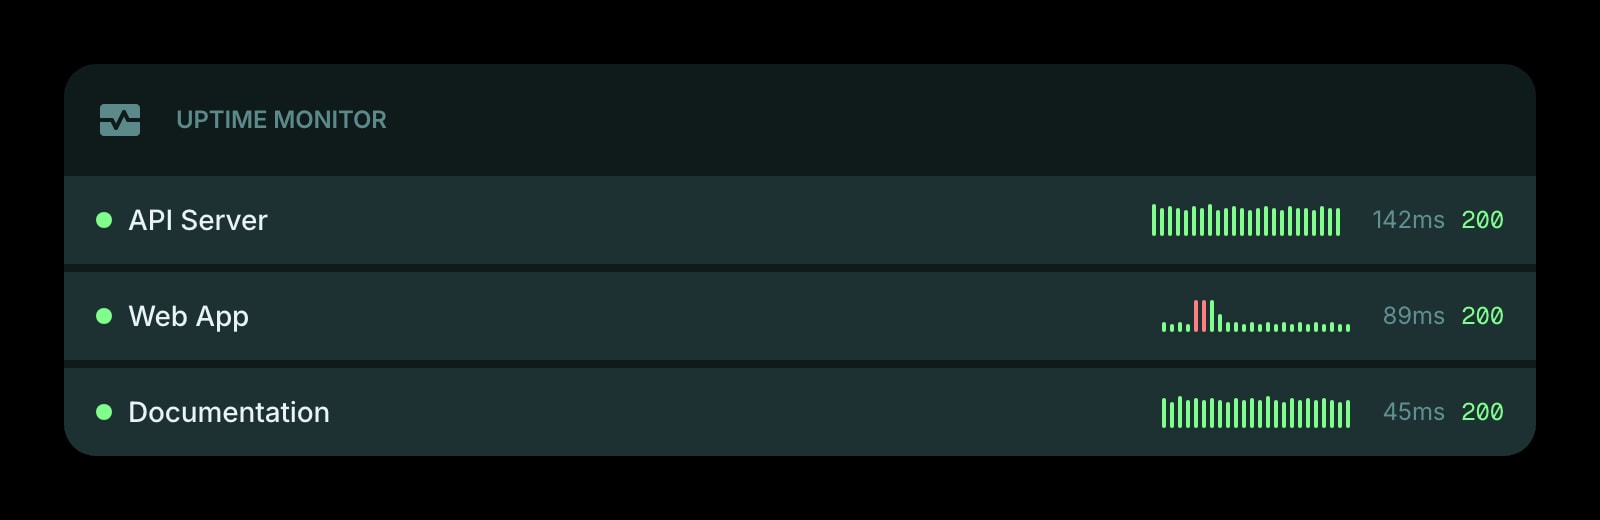
Each site card shows:
- Status dot - green for up, red for down, gray for unknown
- Site name - the label you gave it (or the hostname)
- Response time - how long the server took to respond, in milliseconds
- HTTP status code - the response code returned by the server
- History bar chart - a visual timeline of the last 24 checks, where bar height represents response time and color shows up (green) or down (red)
#Managing Sites
#Adding Sites
Click Add Site in the widget toolbar (in edit mode) or right-click the widget and choose Add Site. Enter a URL and an optional name, then click Save. The https:// prefix is added automatically if you don't include one.
#Editing Sites
Right-click (or tap and hold) a site and choose Edit Site to change its URL or name.
#Checking Now
Right-click (or tap and hold) a site and choose Check Now to immediately refresh the uptime status for that site instead of waiting for the next scheduled check.
#Reordering Sites
On desktop, drag and drop sites to rearrange them. You can also drag sites between multiple Uptime Monitor widgets on the same page.
#Deleting Sites
Right-click (or tap and hold) a site and choose Delete Site. You'll be asked to confirm before it's removed.
#Widget Settings
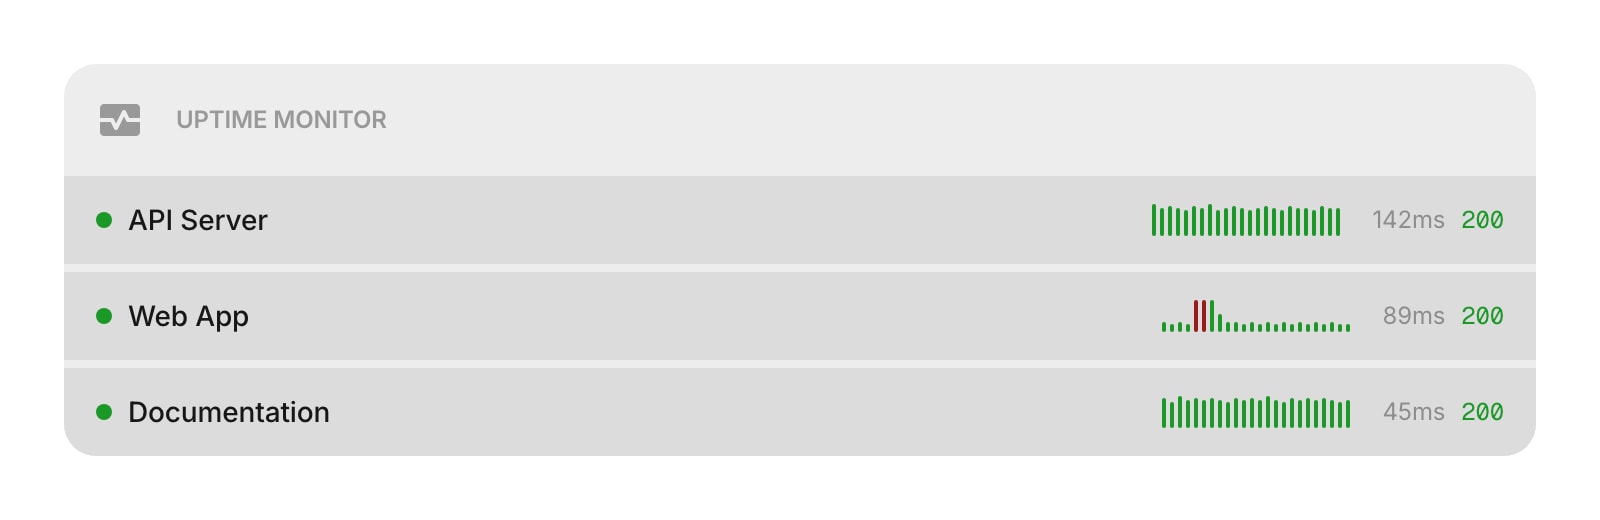
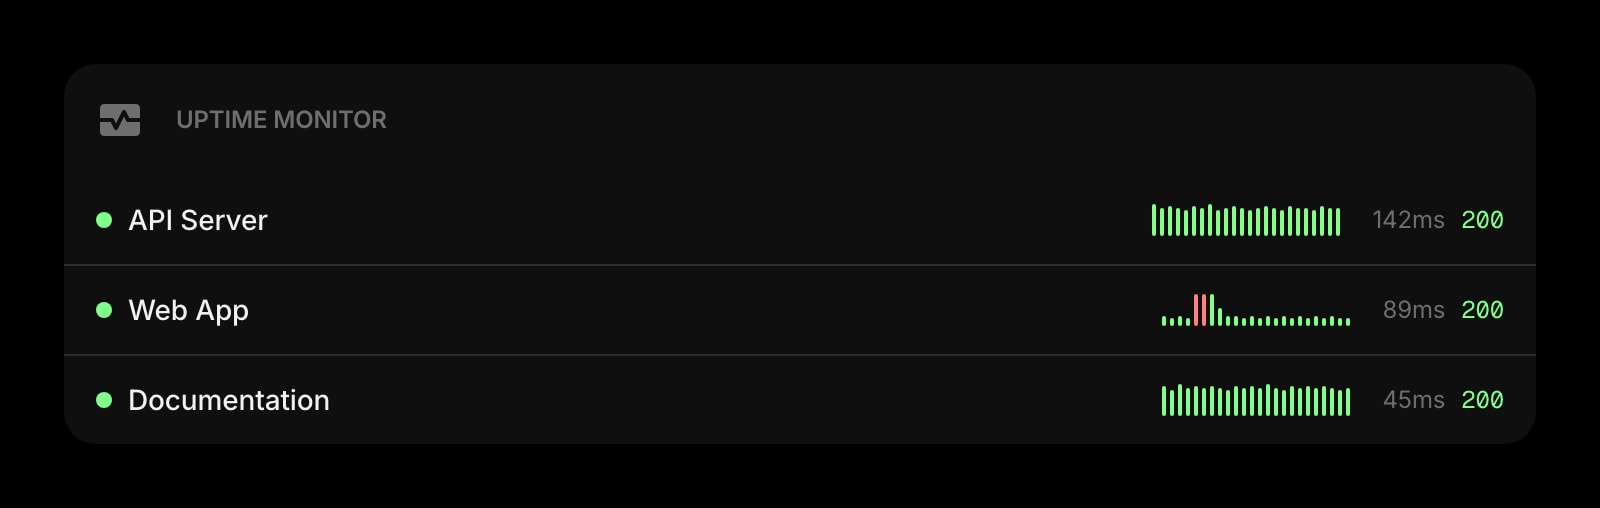
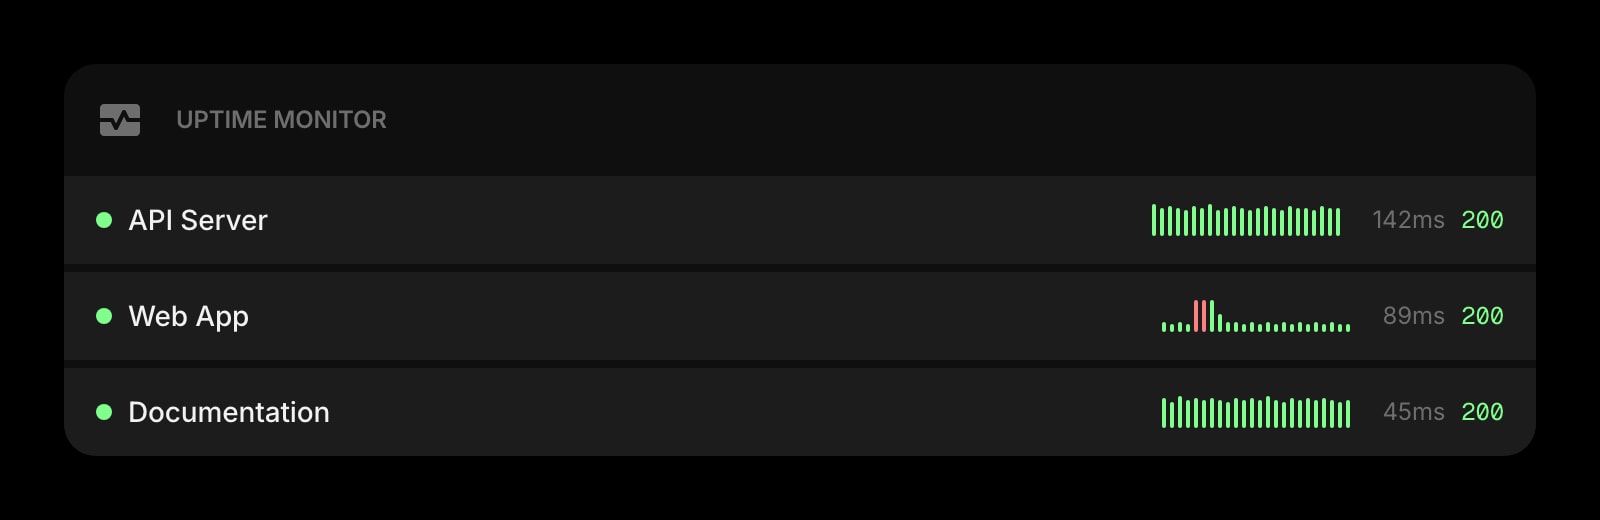
- Item Style - set the look of site cards: Clear, Outline, or Solid (default).
#Tips
- The widget checks each site every 5 minutes and keeps the last 24 check results in the history chart.
- Add multiple Uptime Monitor widgets to group sites by project — for example, one widget for production servers and another for staging.
- The history bar chart gives you a quick visual overview of uptime patterns — green bars show successful responses (taller = slower), while red bars indicate the site was down.
- Your monitoring data is saved automatically, so your uptime history is always there when you come back.