- Dashboard
- Widgets
- AI Diary
- AI Humanizer
- AI Image
- Audio Editor
- Base64 / URL Encoder
- Calendar
- Canvas
- Collection
- Color Picker
- Container
- Countdown Timer
- Currency Converter
- Daily Quiz
- Daily Quote
- Daily Riddle
- Date & Time
- Embed
- GitHub Releases
- Google Calendar
- Habit Tracker
- Hacker News
- Image Compression
- IP Info
- JSON Formatter
- Links
- Markdown Editor
- News
- News Summary
- Notes
- Podcast
- Pomodoro Timer
- Product Hunt
- QR Code Generator
- Quick Answer
- Quick Note
- Regex Tester
- RSS Feed
- Search
- Spacer
- Stopwatch
- Story Snippet
- Stripe Sales
- Subreddit
- Substack
- t0ggles Focus
- t0ggles My Boards
- t0ggles My Tasks
- Tasks
- Text Diff
- Todo
- TradingView Advanced Chart
- TradingView Market Summary
- TradingView Mini Chart
- TradingView Symbol Overview
- TradingView Ticker Tape
- Translation
- Unit Converter
- Uptime Monitor
- Weather
- What If
- World Clock
- YouTube Channel
TradingView Mini Chart Widget
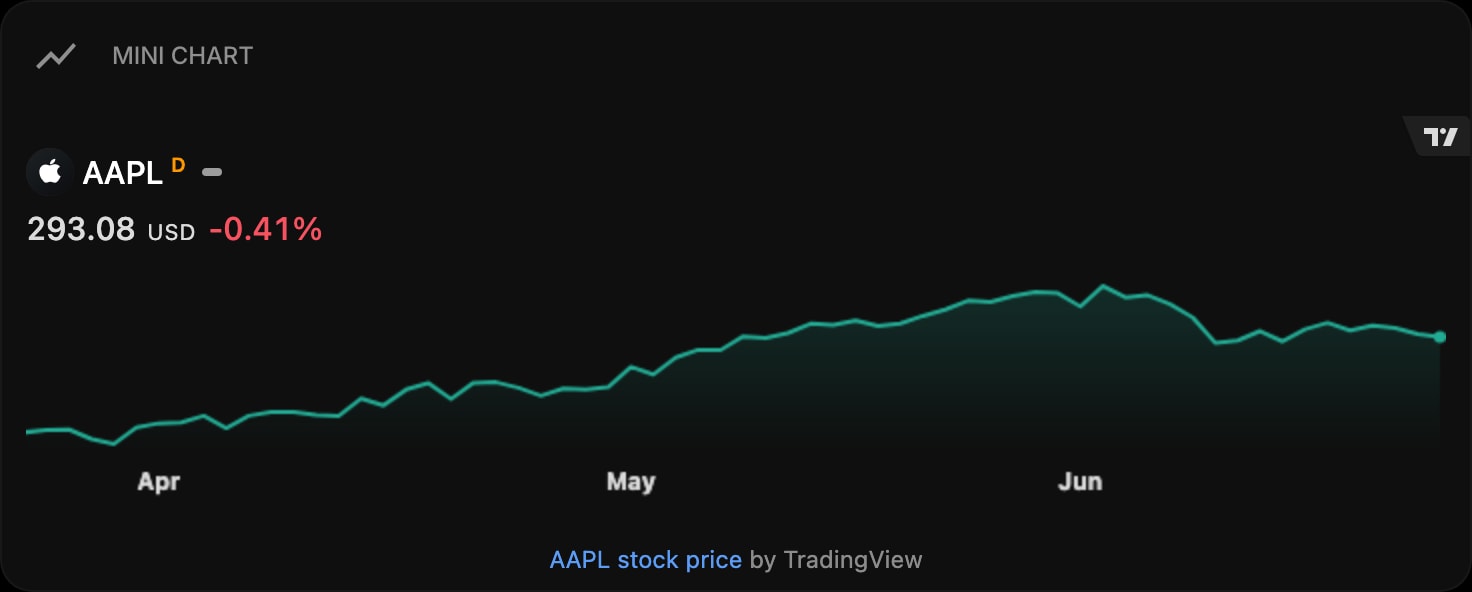
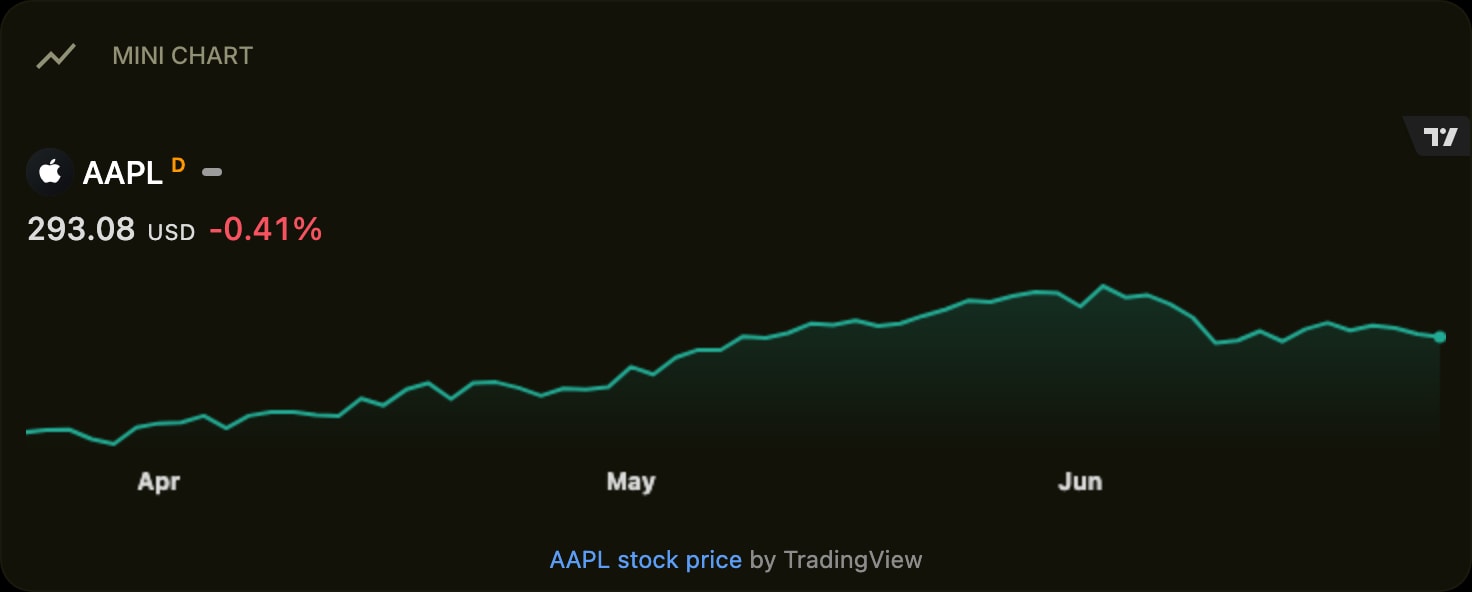
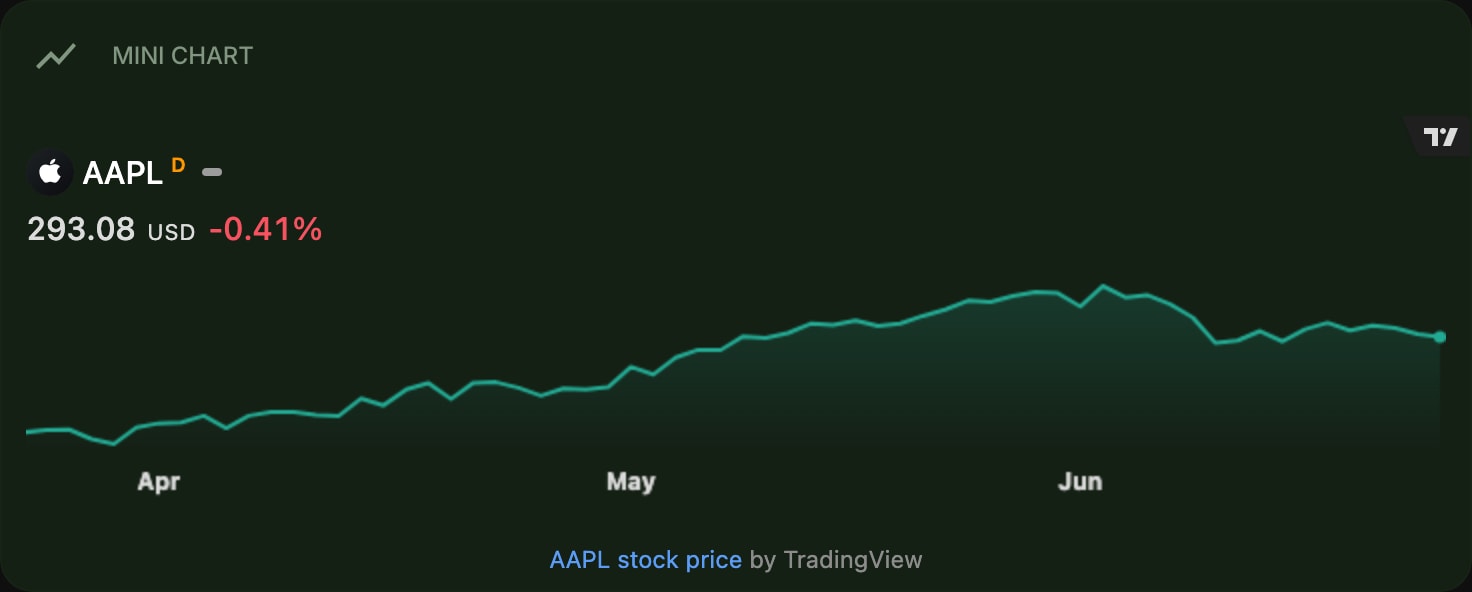

The Mini Chart widget shows a compact, live price chart for a single symbol - a stock, cryptocurrency, forex pair, or index - powered by TradingView. It is the quickest way to keep one ticker in view on your dashboard.
#How to Use
- Add the Mini Chart widget to a page.
- Open the widget settings and click the Symbol picker.
- Search for a company, ticker, coin, or pair and select it from the results.
- Choose a Time Frame and adjust the height to fit your layout.
The chart updates instantly whenever you change the symbol or time frame.
#Widget Settings
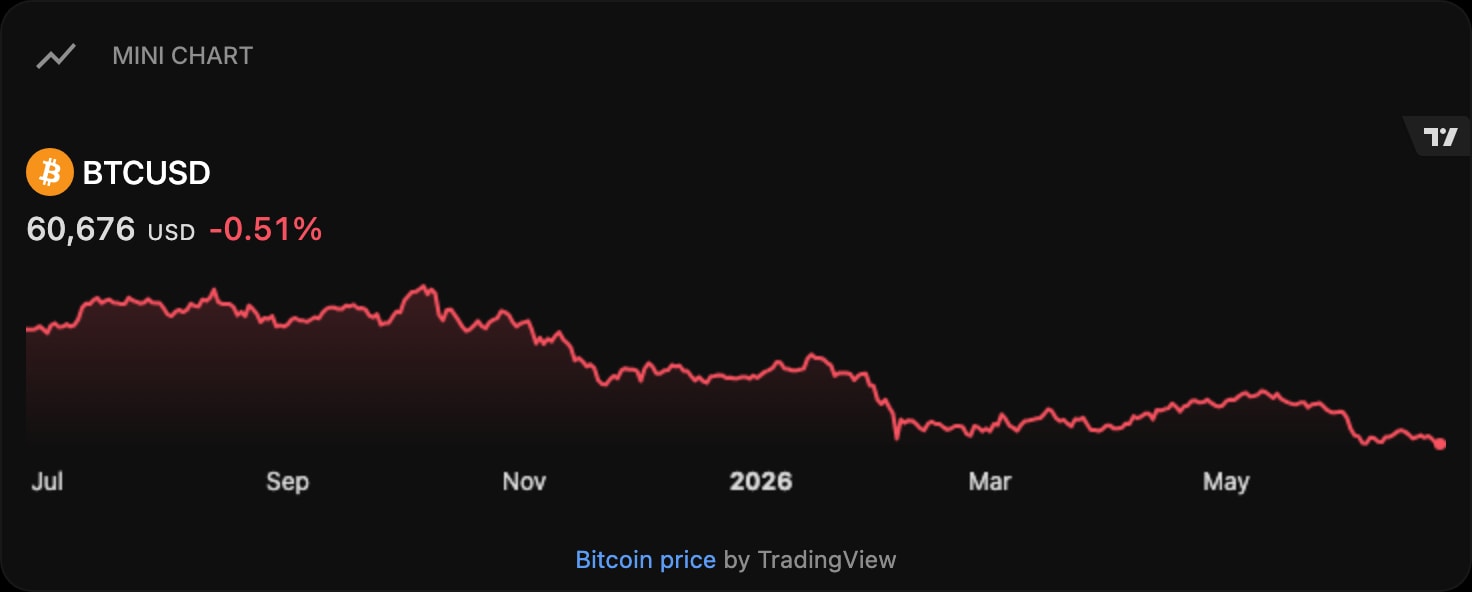
- Symbol - the instrument to chart. Search across stocks, crypto, forex, and indices, then pick from the results.
- Time Frame - the range shown on the chart: 1D, 1W, 1M, 3M, 6M, 1Y, 5Y, YTD, or ALL. Default is 3M.
- Show Time Scale - toggle the time axis along the bottom of the chart. On by default.
- Height - the widget height in pixels, from 120 to 800. Default is 240px.
#Tips
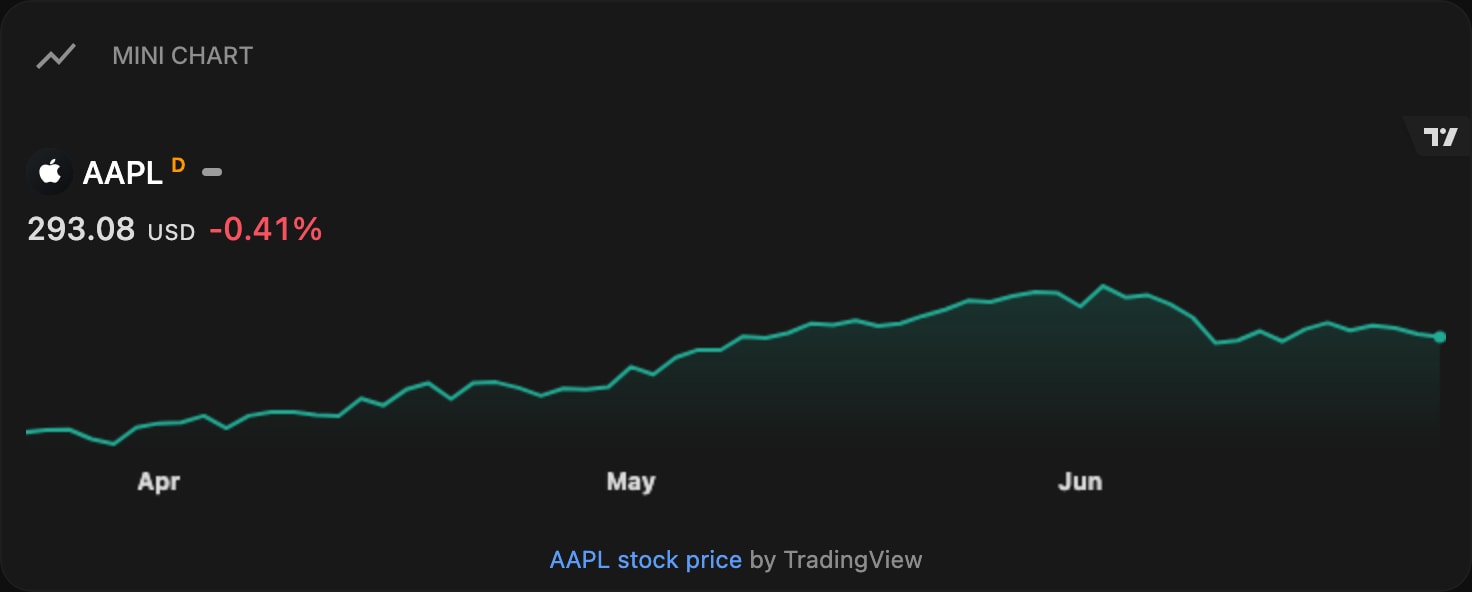
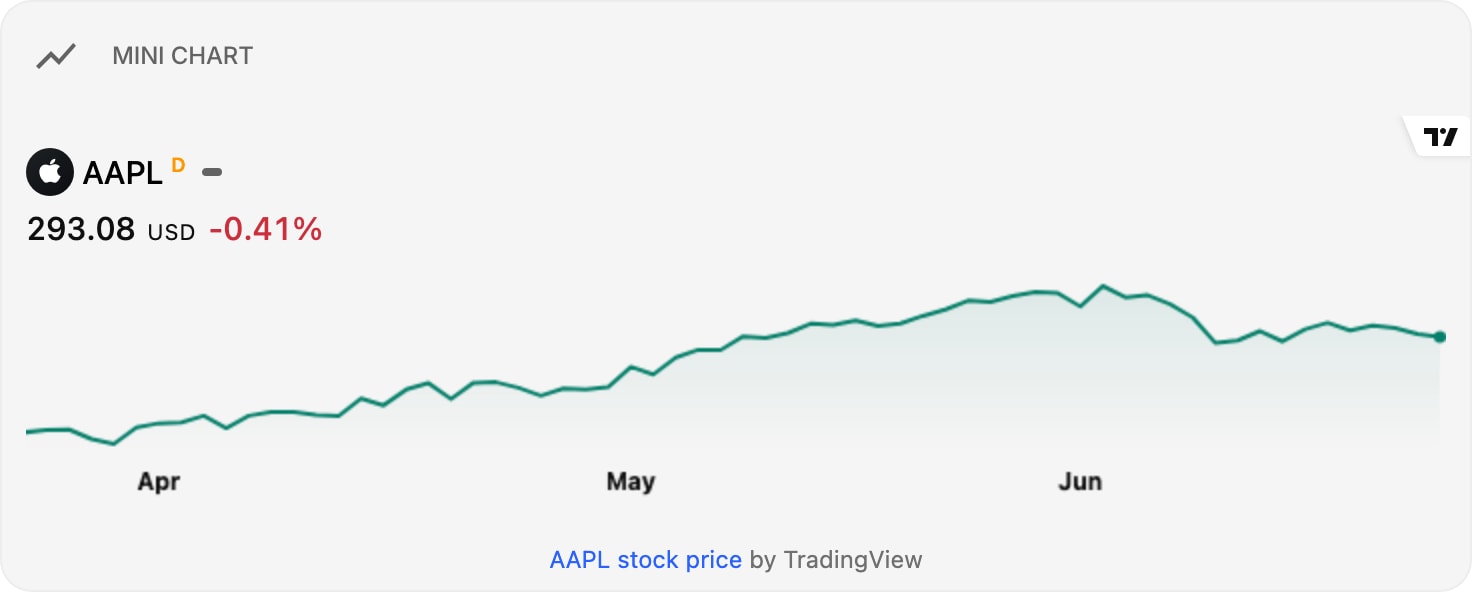
- The chart matches your dashboard theme automatically, switching between light and dark.
- Place several Mini Charts on one page to build a compact watchlist.
- For a full interactive chart with indicators and drawing tools use the TradingView Advanced Chart, or for a scrolling multi-symbol strip use the TradingView Ticker Tape.