- Dashboard
- Widgets
- AI Diary
- AI Humanizer
- AI Image
- Audio Editor
- Base64 / URL Encoder
- Calendar
- Canvas
- Collection
- Color Picker
- Container
- Countdown Timer
- Currency Converter
- Daily Quiz
- Daily Quote
- Daily Riddle
- Date & Time
- Embed
- GitHub Releases
- Google Calendar
- Habit Tracker
- Hacker News
- Image Compression
- IP Info
- JSON Formatter
- Links
- Markdown Editor
- News
- News Summary
- Notes
- Podcast
- Pomodoro Timer
- Product Hunt
- QR Code Generator
- Quick Answer
- Quick Note
- Regex Tester
- RSS Feed
- Search
- Spacer
- Stopwatch
- Story Snippet
- Stripe Sales
- Subreddit
- Substack
- t0ggles Focus
- t0ggles My Boards
- t0ggles My Tasks
- Tasks
- Text Diff
- Todo
- TradingView Advanced Chart
- TradingView Market Summary
- TradingView Mini Chart
- TradingView Symbol Overview
- TradingView Ticker Tape
- Translation
- Unit Converter
- Uptime Monitor
- Weather
- What If
- World Clock
- YouTube Channel
TradingView Market Summary Widget
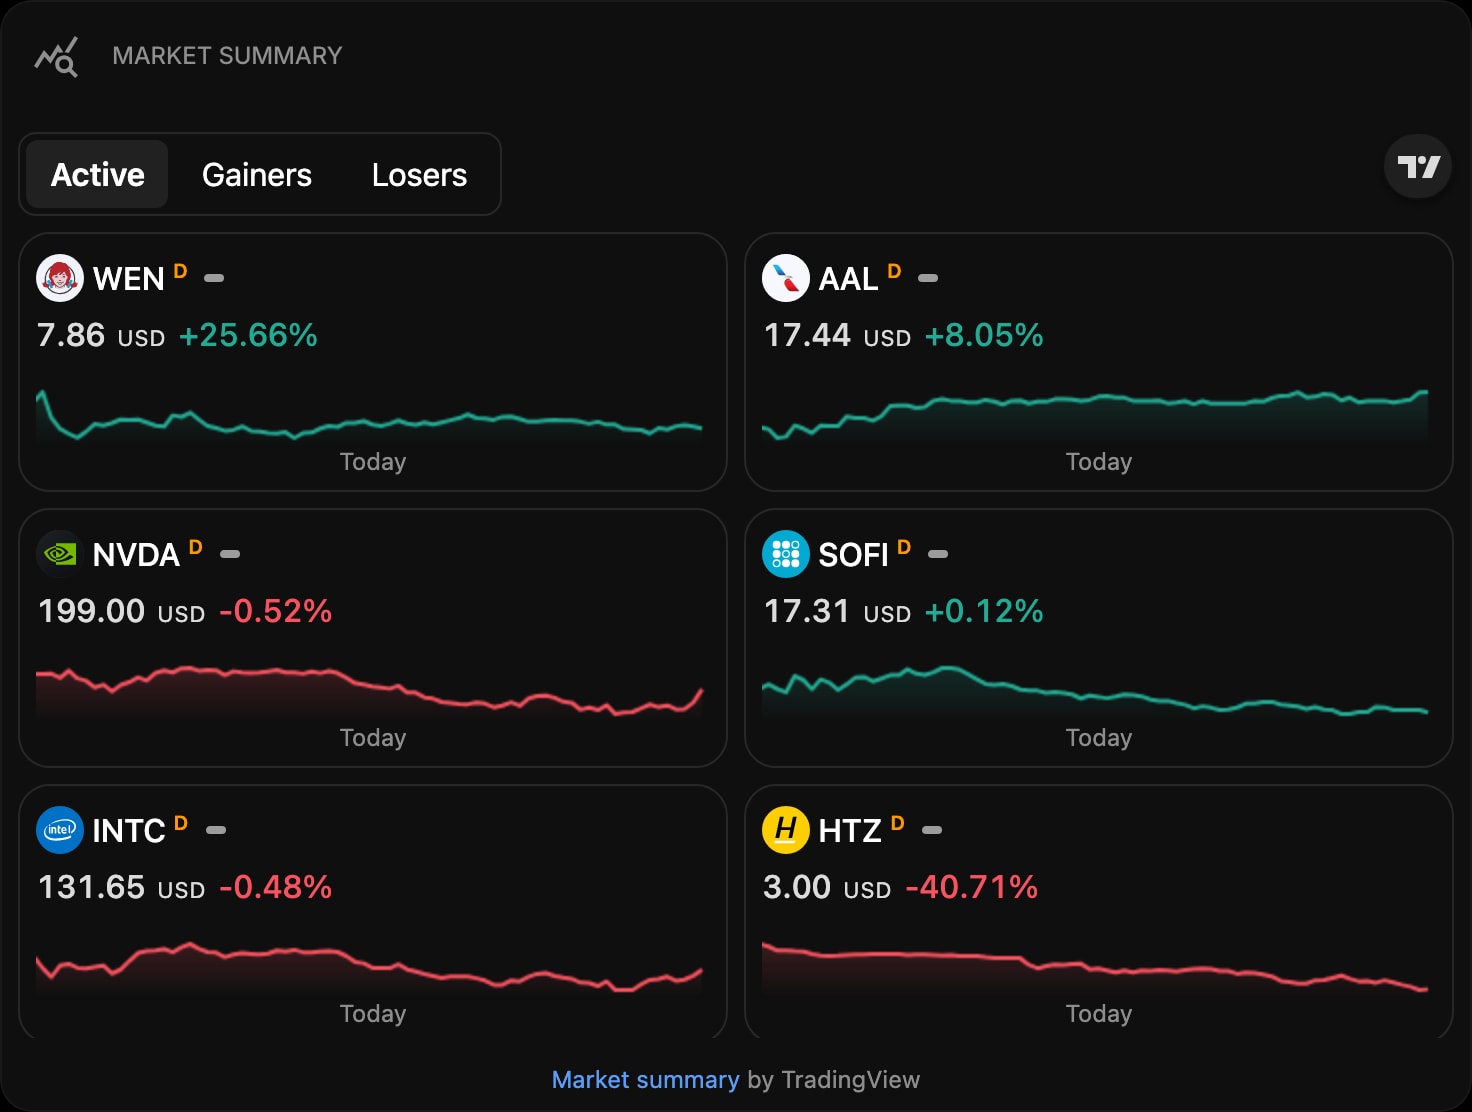
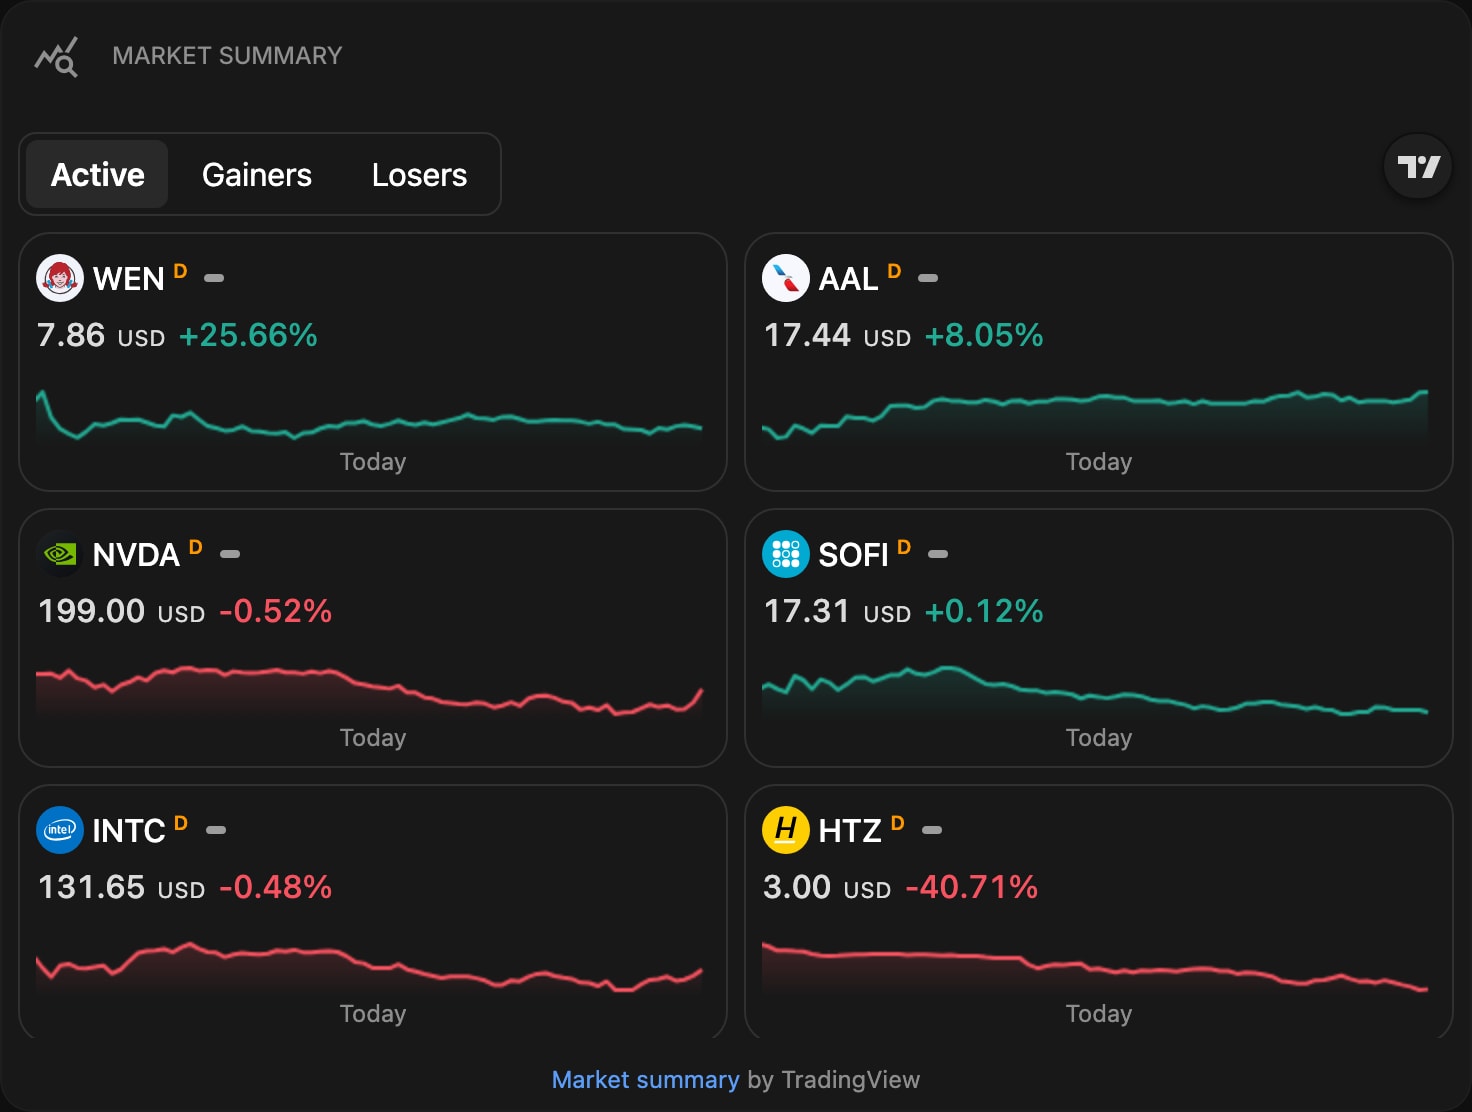
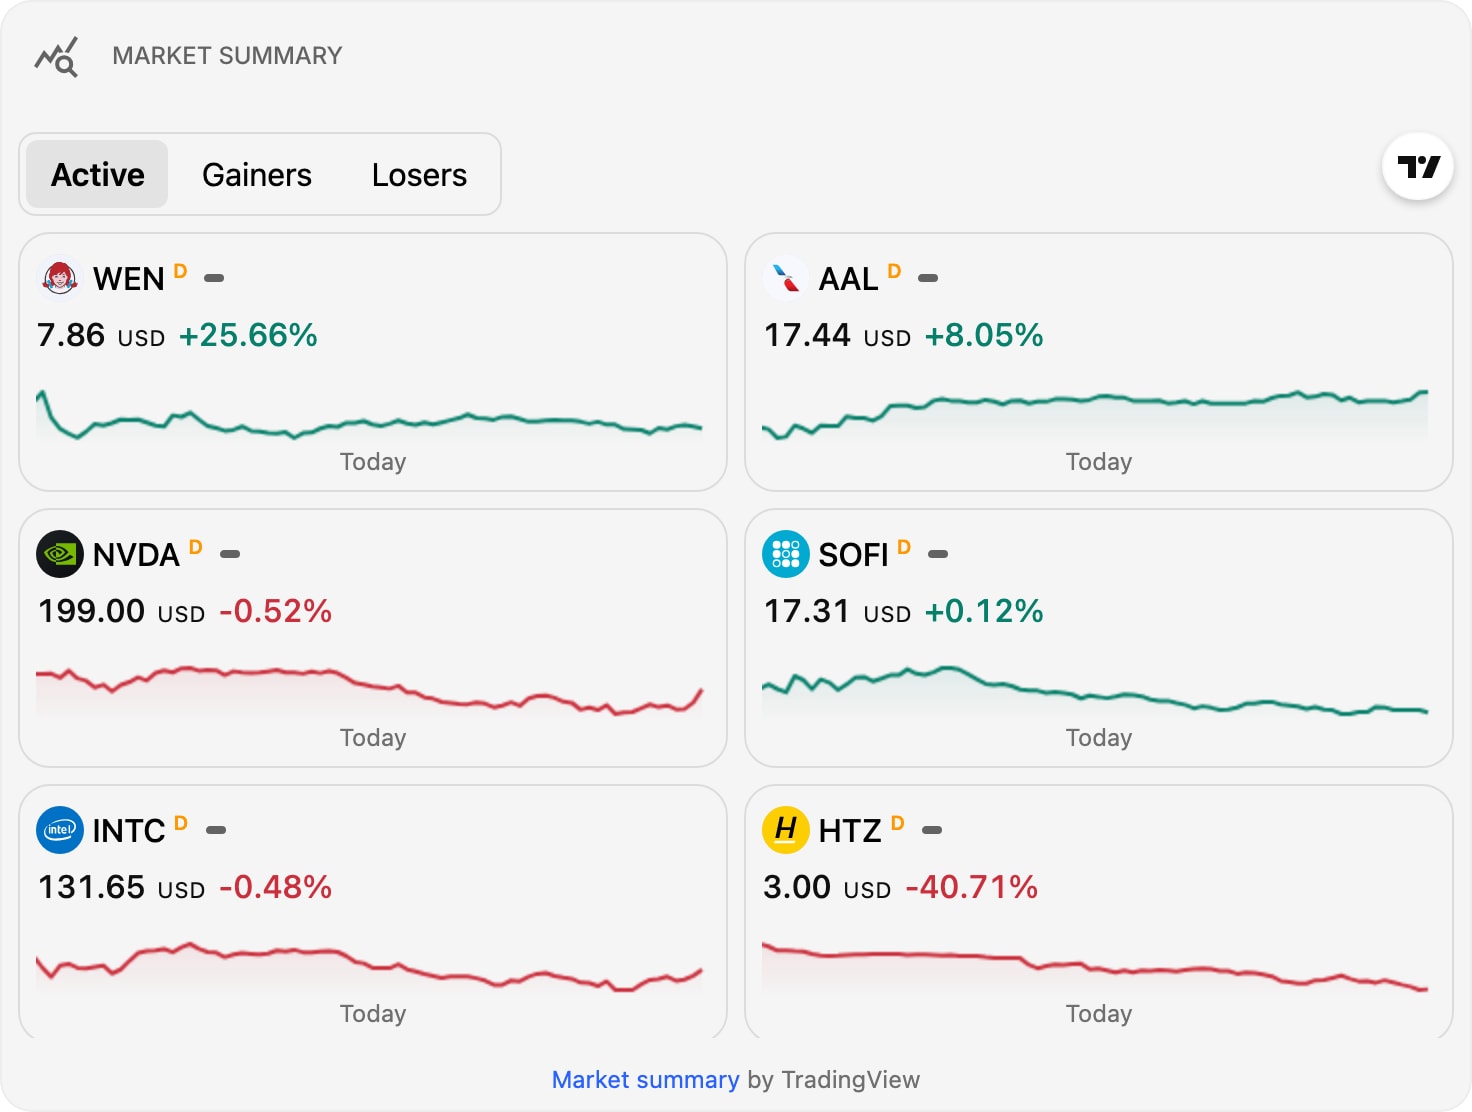
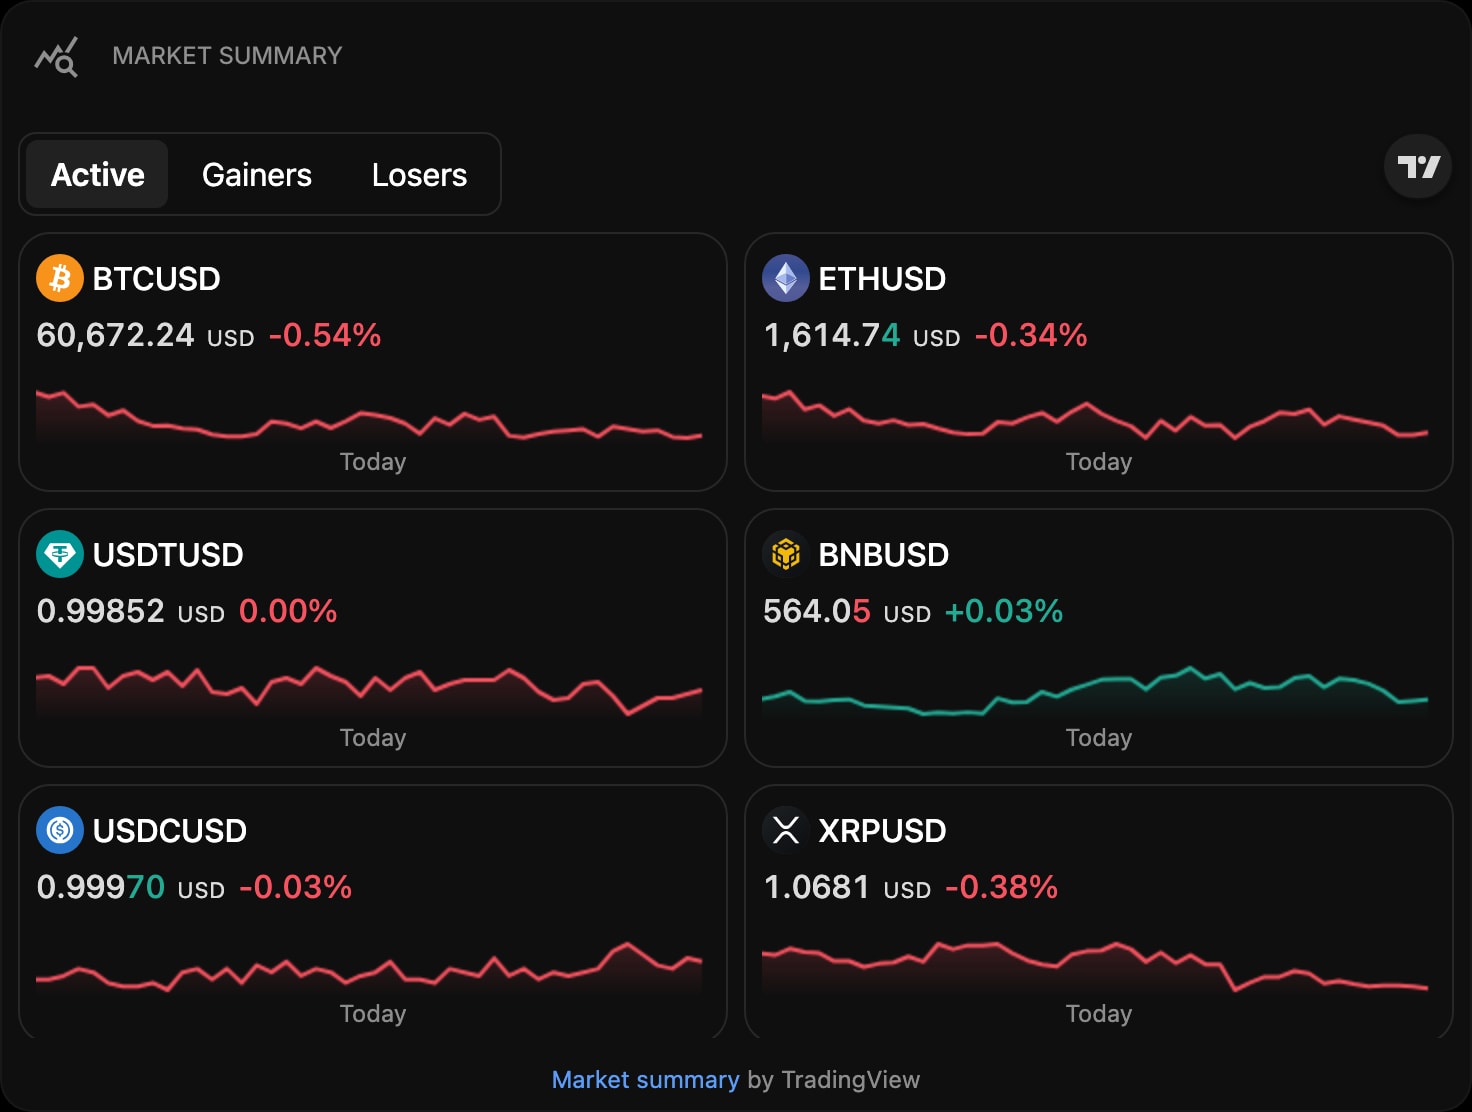
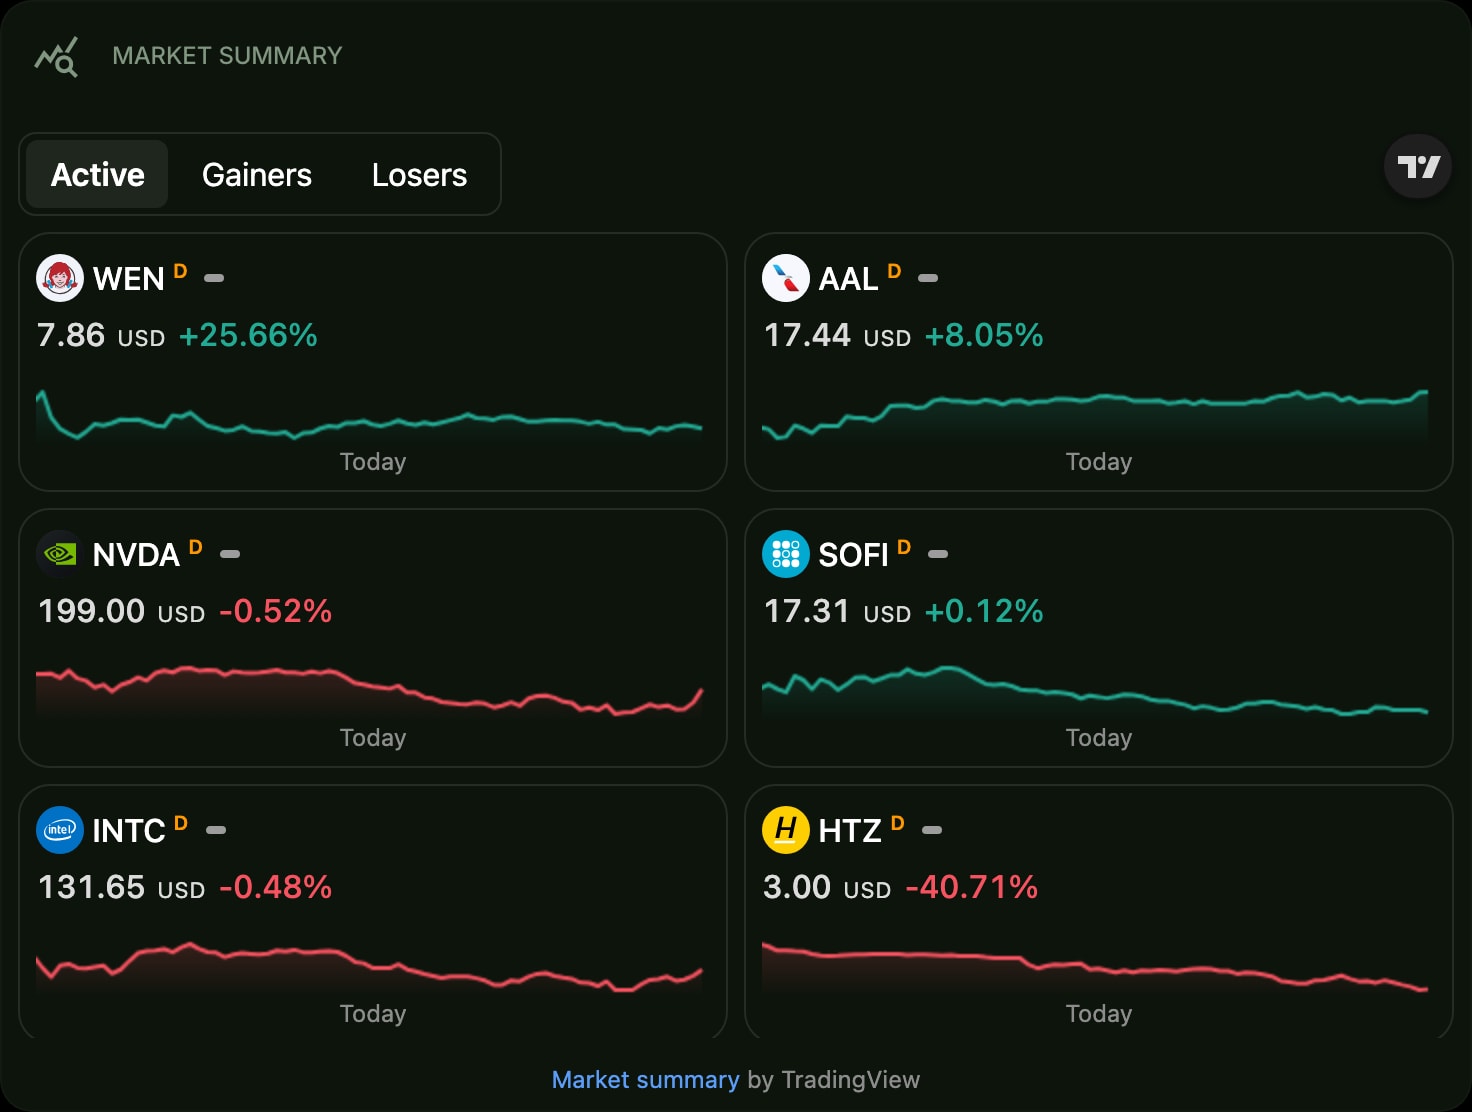
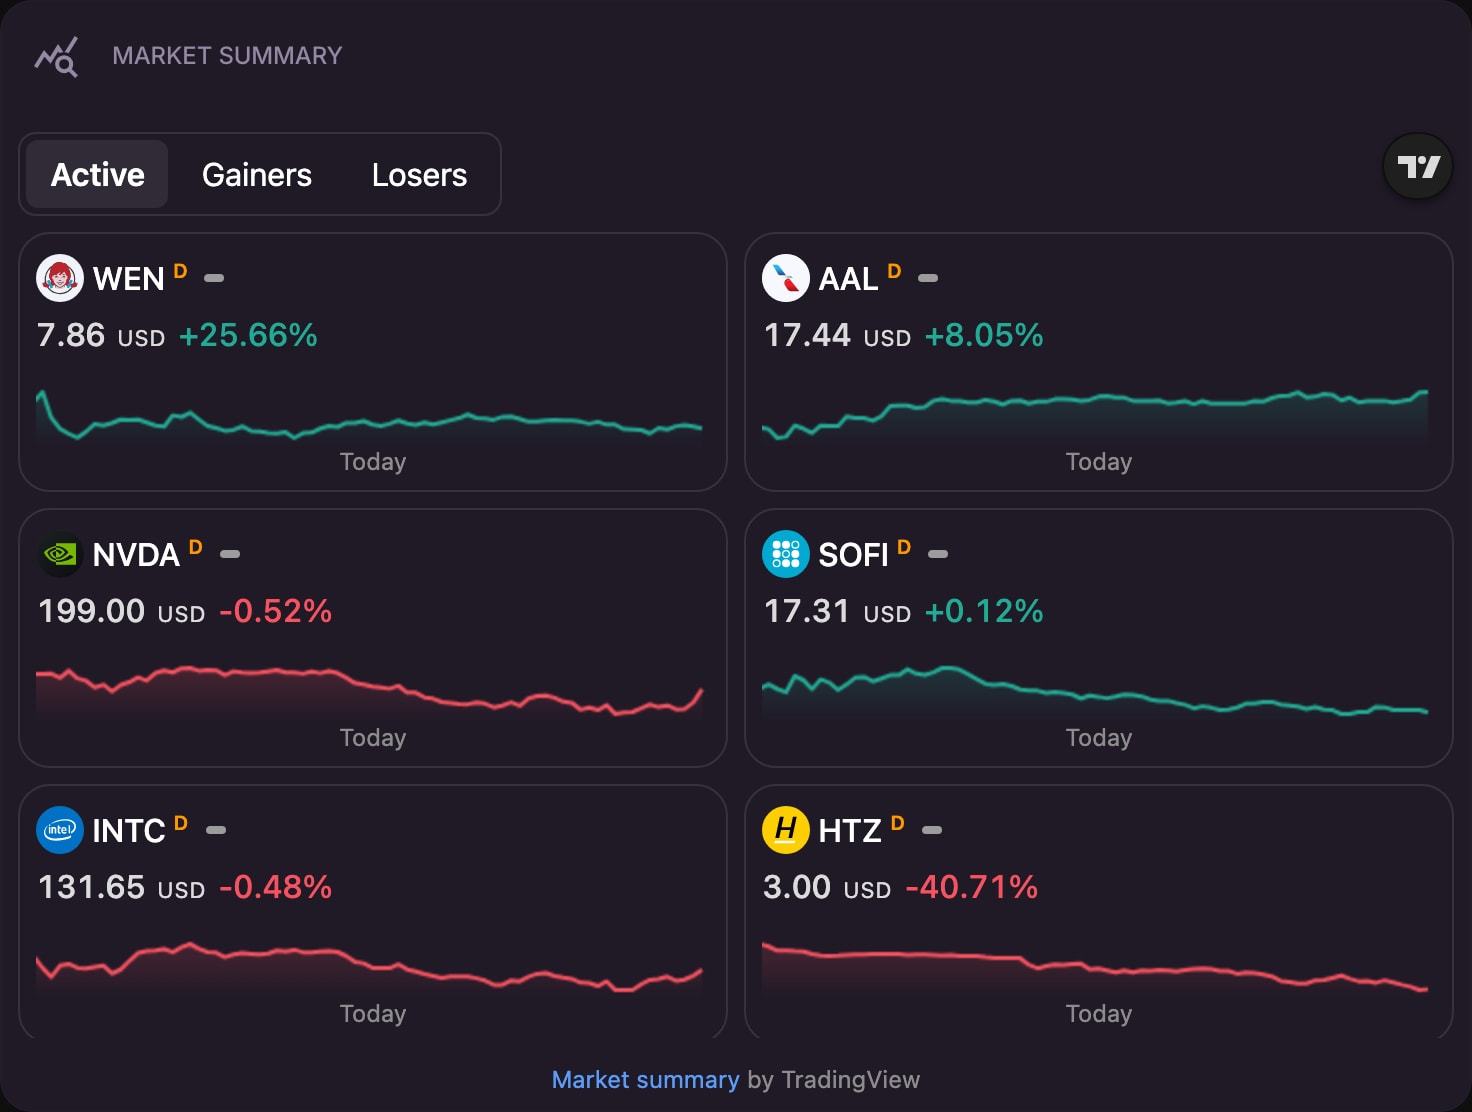
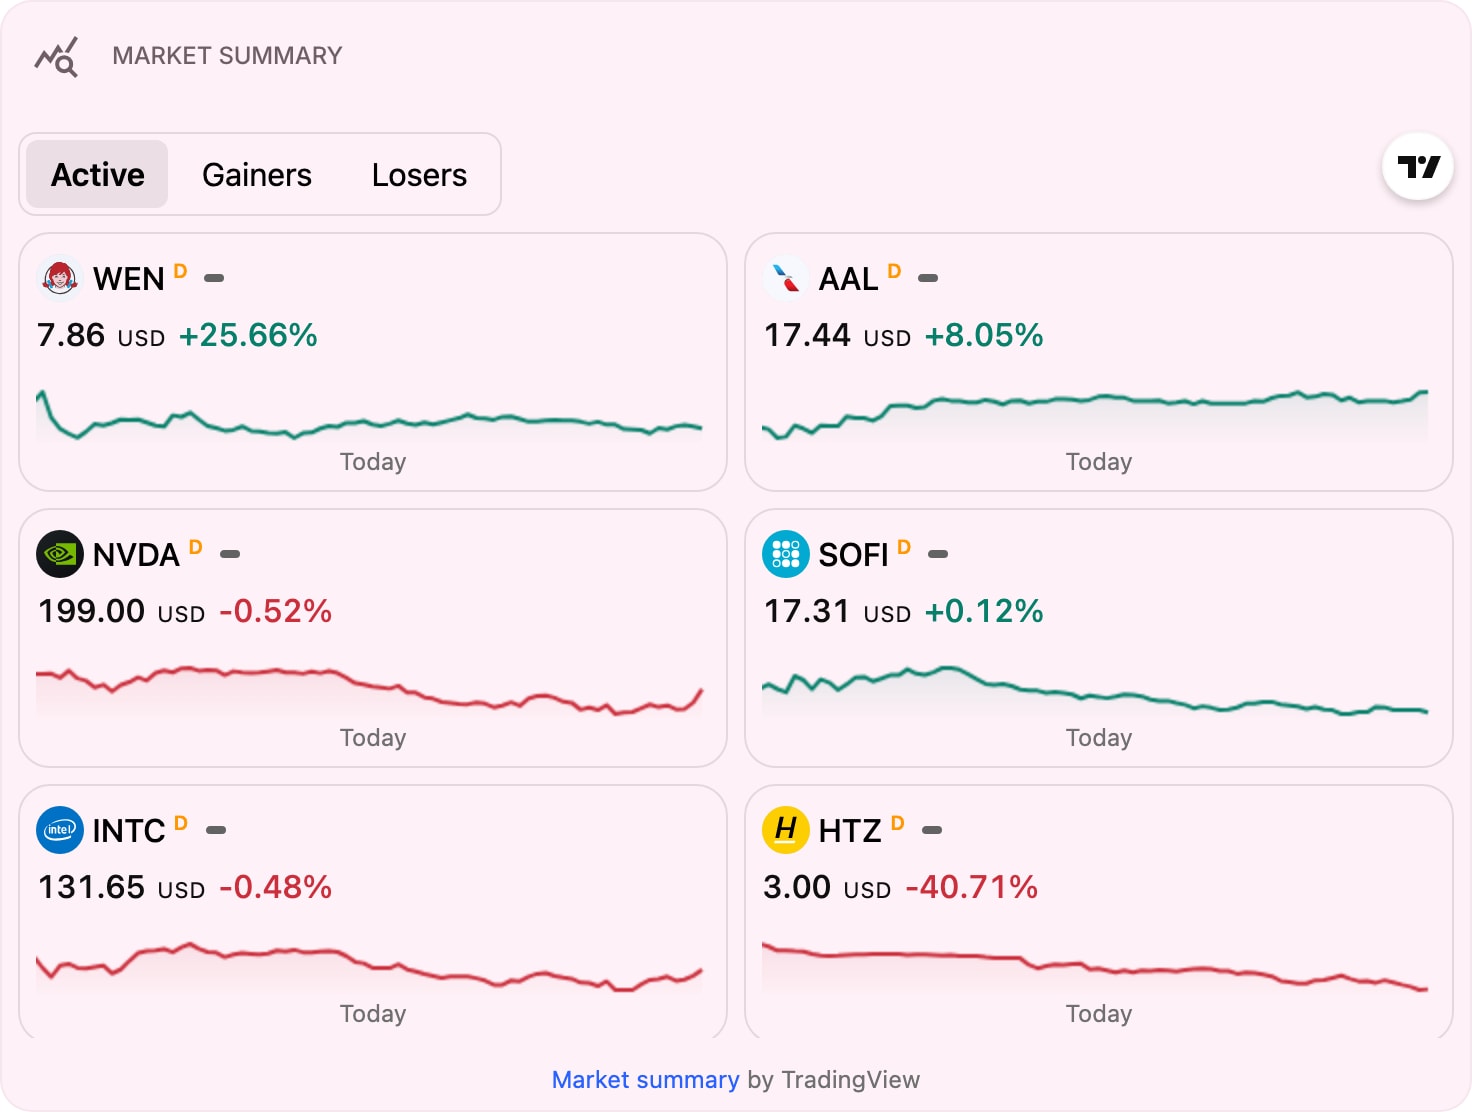
The Market Summary widget gives an at-a-glance overview of the markets, powered by TradingView. Use preset mode for a ready-made stocks or crypto board, or switch to custom mode to build your own grouped watchlist.
#How to Use
- Add the Market Summary widget to a page.
- In preset mode (the default), choose the asset class, layout, item size, and time frame.
- Turn on Custom Mode to assemble your own sectors: name each group and add symbols with the search picker.
In custom mode you can drag symbols to reorder them and add as many named sectors as you like.
#Widget Settings
- Custom Mode - off for a ready-made preset board, on to build your own grouped sectors.
- Assets (preset mode) - stocks or crypto.
- Layout - grid (default) or flow.
- Item Size - normal (default) or compact for a denser board.
- Time Frame - the change period shown for each symbol: 1D, 1W, 1M, 3M, 6M, 1Y, 5Y, YTD, or ALL.
- Direction (flow layout) - arrange the flow layout horizontally (default) or vertically.
- Symbol Sectors (custom mode) - the named groups of symbols you assemble yourself.
- Height - the widget height in pixels, from 200 to 1200. Default is 500px.
#Tips
- Start in preset mode for an instant board, then switch to custom mode when you want your own groupings.
- The board matches your dashboard theme automatically, switching between light and dark.
- For a scrolling strip of quotes use the TradingView Ticker Tape, or for a single symbol use the TradingView Mini Chart.